Theme-first · Techno-fundamental research

The research I do for my own money, written down properly.

I find the strongest themes in the market, study the sector and its peers, and pick the best names within it, the ones that look best on the charts and the fundamentals. Free market dashboards for everyone; the research is for members.

12 yearsin Indian markets
Sundays, 6 pmWeekly Market Compass
SEBI RARegistration in progress

Vikram Batra
Vikram BatraFounder, Quantis · Delhi

Questions? Write to research@quantis.co.in
The Quantis method

Strong theme first. Then the best names within it.

Stocks in the same theme tend to move together. So I don't start with a stock tip. I start by understanding the theme and its sector, map every peer, and only then pick the names that stand out on the charts, on the fundamentals, and with a clear trigger.

STEP 1Find the theme

Which themes have momentum and a real reason behind them: policy, cycle, demand or capex.

STEP 2Understand the sector and peers

How the business works, what drives earnings, and every listed company in the group.

STEP 3Techno-fundamental filter

Trend and relative strength on the chart. Growth, balance sheet and valuation in the numbers. A trigger to move it.

STEP 4The best names in the theme

Each with a target, a horizon and the level that proves me wrong. Members get them on the Priority list, grouped by theme.

Every theme report follows these four steps. Members are alerted when a theme report or a rating changes. What members get

What happened in markets today

End-of-day data from NSE, updated after every close. Free, no login needed.

Indices ›

Close and day's change

Sectors ›

Best four and worst four today

Breadth & movers ›

Advances vs declines, NSE equities

Top gainers

Top losers

Where are you in your investing journey?

Start with the free tools. Join as a member when you want my research and ratings.

Do it yourself Free

See where the market closed, every day.

Indices, valuations, bonds and global markets on one page.

Open Markets ›
Spot which sectors are gaining momentum.

Sector heatmap over 1 day, 1 week, 1 month and the year so far.

Open heatmap ›
Get the week in data, by email.

A free account gets the Friday data recap and a watchlist. Opens at launch.

Sign up free ›

Research assisted Members

Every stock I cover, grouped by theme.

Rating, target, horizon and the level that proves me wrong.

Priority list ›
The week, and what I think about it.

Every Sunday at 6 pm, on the page or as a PDF.

Weekly Compass ›
Theme reports: theme, peers, top picks.

The sector, every peer compared, and the best names on charts and fundamentals. Every call stays on the record.

Notes & library ›
Compare plans

Illustrations only. The figures in the mock-ups are not real calls.

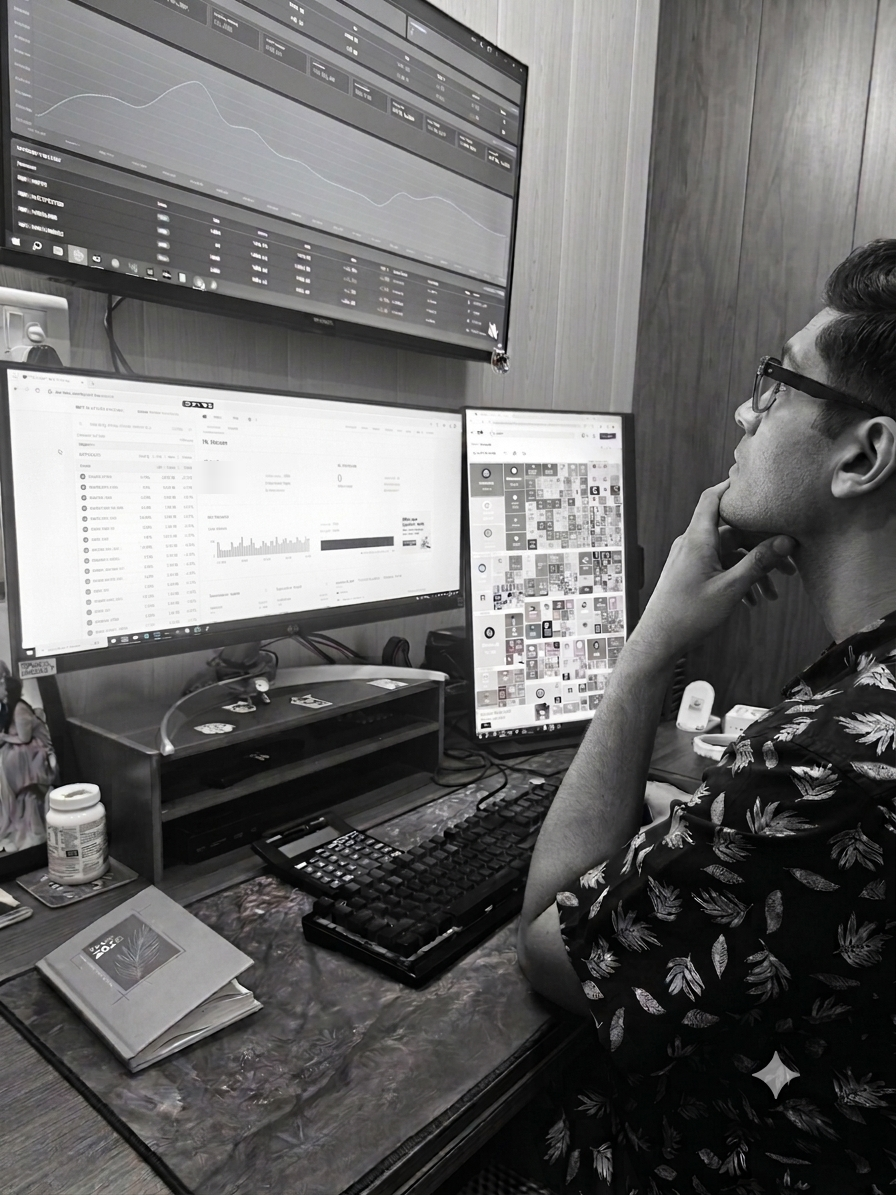
Vikram at his trading desk
Who writes it

I'm Vikram Batra. This is my desk.

I have spent twelve years in Indian markets, most of that trading my own money. That is a slower and more expensive education than any certificate, and a more honest one.

I run Quantis from Delhi, on my own. There is no team behind me, and that is deliberate. The person who does the research and makes the call is the person who writes it up for you.

Quantis Research is that work, written down: the same research I do before putting my own capital to work, in a form you can follow week to week.

12 yearsin Indian markets
Every notewritten by me
Delhiindependent, no team
More about me

A publishing calendar you can rely on

Member research runs on a fixed rhythm, so you know when to look.

WeeklySunday, 6 pm

Weekly Market Compass

MonthlyWednesday, 7 pm

Theme report: the theme, its peers and the best names within it

MonthlyWednesday, 7 pm

Stock note: a deep dive on a pick, or a rating change

QuarterlyBefore results season

Outlook, theme scorecard and closed-call review

Market data is free. Research opens after registration.

Sign up now and you'll hear the day membership opens. Nothing is sold, and no views are published, until SEBI registration is granted.

Sign up free Open Markets